The race to Net Zero: How to navigate a new world of climate commitments
Share
As tens of millions of fans tuned into the Euro 2020 football competition last summer, one company was hoping that their eyes picked out a catchy new slogan on the pitch-side billboards.
One of Europe’s biggest carmakers and one of the competition’s sponsors, had bought this prime advertising space to promote their commitment to being carbon-neutral or ‘Net Zero’ by 2050. In their marketing-speak, this was their ‘way to ZERO’.
Sometimes we can gauge the public mood by the adverts companies choose to promote. The automaker’s decision to advertise their Net Zero pledge at a European football competition reflected their knowledge that awareness of climate change had risen quickly among Europeans.
That rising awareness is reflected in Google Trends rankings, where searches for ‘Net Zero’ hit a 5+ year global high in May 2021, before seven new peaks were hit between September and November.
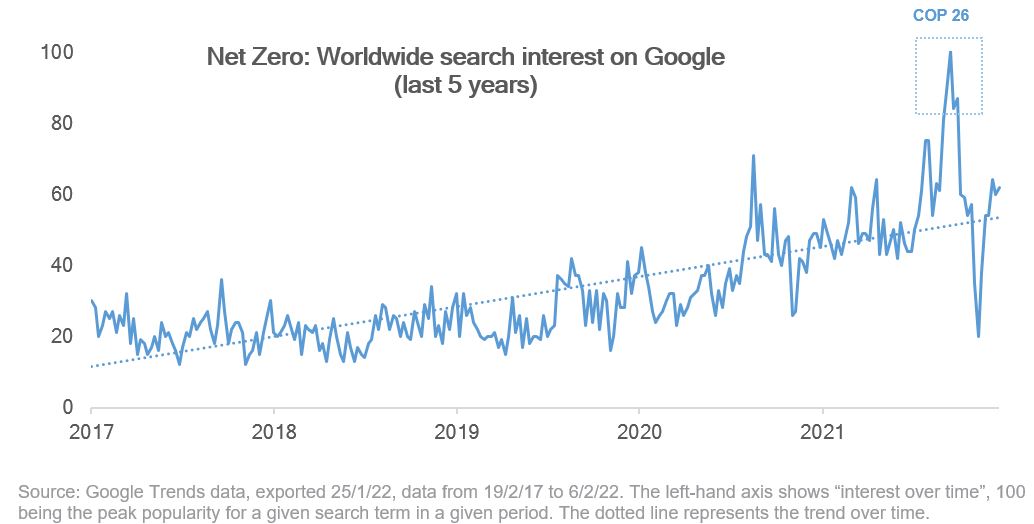
This search data, and the proliferation of Net Zero adverts, show what we can already feel from reading the news or watching TV: that more and more companies, investors, and governments are committing to carbon neutrality and Net Zero.
Why it feels like everyone is going Net Zero
If so many areas of society, from governments to companies, investors to normal citizens are committing to Net Zero, the question is: why?
The answer is simpler than it might seem. More people have realised that humanity must reach Net Zero on greenhouse gas emissions if it will ever stabilise human-induced global temperature increases, no matter what temperature level is chosen as the maximum level, whether 2°C or 1.5°C above preindustrial levels.
Without Net Zero, global temperatures will keep rising forever.
When we look at a temperature goal such as 1.5°C, which was enshrined as the ‘ideal’ limit in the Paris Agreement, it’s important to realise that global temperatures have already risen a significant part of that. On average, temperatures today are more than 1°C higher than the preindustrial level – a reference period between 1850-1900 chosen as it is the “earliest period with near-global observations”.
While temperatures have already increased, achieving Net Zero by 2050 has the power to cap the overall temperature increase at a level that causes the minimum amount of climate change. Companies well positioned to achieve this goal with their products and operations should greatly benefit. Investors, aside from moral considerations, will want to pick these “Net Zero” winners, and avoid losers. Taken together, these motivations are driving a global race to Net Zero.
The race Net Zero
- Countries
Several countries seem to be racing each other for Net Zero. Germany is one: in May 2021, the German government announced its intention to reduce carbon emissions by 65% by 2030, 85-90% by 2040, and to be Net Zero emissions by 2045. Germany has consistently been Europe’s highest CO2 emitter, and the country’s previous goals were a 55% reduction by 2030 and carbon neutrality by 2050. Among other notable government commitments, the US Biden administration has announced a -50%/52% cut by 2030, and the UK committed to a hefty -78% reduction by 2035. - Corporations
The race to Net Zero is found in the corporate world, too. Around 3,100 companies have set Net Zero goals by 2050 as part of the UN-backed “Race To Zero” initiative, and recent report found that “of the world’s 2,000 largest public companies, at least one-fifth (21%) now have Net Zero commitments, representing annual sales of nearly $14 trillion.”1
Dozens have committed to Net Zero even sooner. These include Schneider Electric by 2030, Unilever by 2039, Coca Cola, Orange, Amazon all by 2040, and Engie by 2045. Microsoft pledged in 2020 to be carbon negative (i.e. not just neutral) by 2030, with or without compensation, and by 2050 to “remove from the environment all the carbon the company has emitted either directly or by electrical consumption since it was founded in 1975.” The Paris Agreement targets carbon neutrality in 2050, so we are seeing some of the world’s major companies commit to an even more stringent timeline. - Investors
Investors have also joined the race to Net Zero, with several setting very public targets for carbon neutrality in their portfolios, in some cases even sooner than 2050. Sweden’s Swedbank Robur and the UK-based Aviva target carbon neutrality by 2040, while J Safra Sarasin aims for the same by 2035. These investors are choosing to go one step further than the major initiatives such as the Net-Zero Alliance (for asset owners) and Net Zero Asset Managers Initiative (for asset managers), the latter of which Amundi joined in July 2021.
Scrutinising climate commitments
Looking at the climate pledges made across countries, companies and investors, a picture is painted of impressive progress towards sustainability and emissions reduction. However, as investors, we must resist the urge to get swept along by impressive announcements and stories, without subjecting them to proper scrutiny.
In truth, each statement laid out above represents a slightly different reality and different targets. We must be very discerning in our approach to overbidding in the race to Net Zero, to ensure that assets are invested for maximal impact and to avoid falling prey to greenwashing.
To navigate the new world of Net Zero, there are certain important tips to bear in mind which can help you to interpret what a commitment really means.
Step #1: Understand the “carbon budget”
Carbon budget, like Net Zero, is a commonly heard but sometimes misunderstood term.
This term refers to the remaining amount of CO2 that can be emitted globally, beyond which point a given temperature outcome (e.g. above 1.5°C, or above 2°C) is ‘locked in’.
Carbon budgets can be accurately calculated because we increasingly understand the correspondence between cumulative emissions and temperature increases, and also between warming and meteorological changes across regions.
We know the current level of global warming (+1.1°C above the preindustrial2). We also have a maximum level of warming beyond which we can expect severe climate impact (1.5°C). And because of improved modelling, we understand that there is a near-linear relation between cumulative emissions and warming – put simply, a given amount of emissions leads to a given level of warming.
With these three inputs, we can calculate how much CO2 can be emitted before we blaze through the 1.5°C and 2°C barriers.
Between 1850-2019, approximately 2,390Gt CO2 equivalent was emitted2. To have a roughly 2/3 (67%) chance of keeping warming to 1.5°C, there is around 400-500Gt CO2 left to ‘spend’. Currently, the world emits approximately 42Gt per year3 – a figure which would use up the remaining amount in 10-15 years.
When you hear someone talk about carbon budget, it refers to a very simple concept. We have already spent 2,390Gt. We have around around 500Gt left to spend. Carbon budgeting is all about how to spread out that final allowance over time.
Step #2: Factor in “base date”
Now that we are clear on the concept of carbon budget, the next most important term to understand when interpreting climate commitments is the “base date”.
A base date is an anchor point used in any commitment to reduce emissions. This is just as important as the target year, and generally far less visible.
For example, the EU’s latest “Fit for 55” legislation package targets a reduction in GHG emissions of -55% by 2030 (revised up from -40% then -50%). This -55% target is calculated versus a base date of 1990. The same is true for Germany’s updated -65% 2030 target, and the UK’s -78% – they all use 1990 as a reference point. But the US commitment, in contrast, uses a base date of 2005.
You might be thinking: so what? Well, when interpreting a commitment that promises a percentage decrease by a certain point, a base date is required to make any sense of it. You can say “I will halve my consumption of chocolate” – but do you mean compared to the two bars eaten yesterday, or the 20 bars eaten on this day last month?
To examine this idea further, we can take the example of Amundi’s Paris-Aligned ETFs. These track Paris-aligned Benchmarks (PAB) which apply an immediate -50% reduction in GHG emissions compared to a parent index (e.g. an MSCI World Paris-Aligned ETF is based on the MSCI World index). Having reduced emissions by 50%, they continue to decarbonise at a rate of 7% per year.
Now we will want to contextualise these claims. What is the base date?
Amundi provides Paris-Aligned ETFs tracking indices from either S&P Dow Jones or MSCI. The base date for S&P Paris-Aligned ETFs is February 20204, it is May 2021 for those tracking MSCI Climate Change Paris-Aligned Select Indices, and March 2022 for those tracking MSCI SRI Filtered PAB indices5.
The central IPCC scenario used to limit warming to 1.5°C is based on GHG emissions peaking in 2020, reaching the target 50% reduction milestone in 2030, and Net Zero in 2050, which corresponds to a pathway reducing gross emissions by 7% each year until 2050. Paris-Aligned ETFs go one step further than this scenario. They reduce emissions by -50% at the base date, and then adopt the -7% yearly trajectory afterwards.
Thanks to the initial buffer, this methodology goes beyond the 1.5°C scenario codified in Paris, meaning that Amundi’s Paris-Aligned ETFs should be Net Zero sooner than 2050 – if we follow the same assumptions.
Step #3: Challenge baked-in assumptions
Speaking of assumptions, there is one final point to remember to be an informed climate investor. So far, we’ve looked at the importance of understanding carbon budget, and interpreting emissions reductions targets in relation to the base date used.
However, aside from rare businesses which can ‘go Net Zero’ today, these pledges are at best trajectories for change over several years, trajectories which are based on important assumptions.
These assumptions include the ability to decarbonise at a given pace (i.e. higher than today’s pace) in future, or that there will be development of more effective carbon capture & storage solutions to mitigate emissions.
The chart below demonstrates the expected contribution of negative emissions in the path to Net Zero. All the central scenarios from Intergovernmental Panel on Climate change (IPCC) and International Energy Agency (IEA) rely heavily on negative emissions, meaning carbon removal. Carbon removal allows for some level of carbon emissions to continue, as the net balance is still neutral or negative. Reaching Net Zero before 2050 (e.g. 2040) would mean either decreasing gross emissions faster than 2050 scenarios, and/or using higher assumptions of negative emissions.
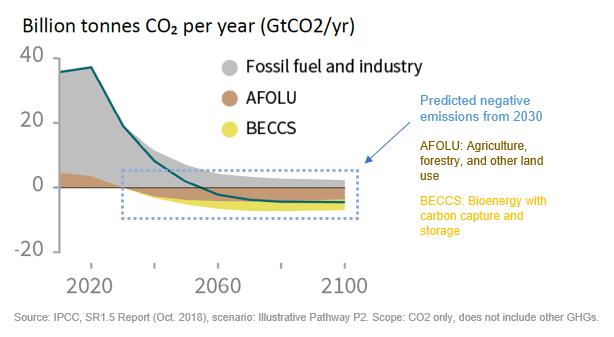
It's important to be realistic with ourselves about the assumptions shown in the chart above. In some cases, the technology that is expected to deliver improved carbon removal is still in the theoretical or prototype stage. This might explain why the May 2021 report from the IEA recommends trajectories based on faster emissions reduction but lower carbon removals. The assumptions can change over time, and an informed investor should understand this.
To illustrate again with Amundi’s Paris-Aligned ETFs: earlier, we said that these ETFs should hit Net Zero before 2050. Thanks to the 50% emission reduction buffer at inception, our calculations, based on previous modelled trajectories, suggest that Amundi’s global S&P Paris-Aligned ETF (as an example) would be Net Zero slightly ahead of the 2050 deadline, around 2045.
Based on latest IEA scenario (faster reduction after 2030 and lower removals), we would expect this ETF to achieve Net Zero closer to 2049 – demonstrating how changes in assumptions can affect the expected outcome.4
Net Zero is an extremely positive shift – but it still requires proper scrutiny
None of this is to take anything away from the importance of Net Zero and the great progress that has already been made. Amundi is a firm believer in the urgency of climate change and the great opportunity and responsibility that lies with investment managers and asset owners to move this change forward.
We believe that all market participants should feel equipped with the best possible information to make the right choices – and this includes an ability to look beyond headlines and assess commitments with a clear eye.
Our Climate Clarity guide was written with this goal in mind, to help investors put the Paris Agreement goals into practice. Otherwise, all the key information on Amundi’s full climate and ESG ETF range is available on our website's climate hub.
1.Taking stock: A global assessment of net zero targets, ECIU and Oxford Net Zero, March 2021 https://eciu.net/analysis/reports/2021/taking-stock-assessment-net-zero-targets
2.IPCC Working Group I report, the first instalment of the IPCC’s upcoming Sixth Assessment Report (AR6), August 2021 https://www.ipcc.ch/report/ar6/wg1/downloads/report/IPCC_AR6_WGI_SPM.pdf
3.IPCC Special Report on Global Warming of 1.5 °C (SR15), October 2018 https://www.ipcc.ch/sr15/chapter/spm/
4.S&P Paris-Aligned & Climate Transition (PACT) Indices https://www.spglobal.com/spdji/en/documents/methodologies/methodology-sp-paris-aligned-climate-transition-pact-indices.pdf
5.MSCI Climate Change Paris-Aligned Select Indexes https://www.msci.com/eqb/methodology/meth_docs/MSCI_Climate_Change_Paris_Aligned_Select_Indexes_Methodology_May2021.pdf
MSCI SRI Filtered PAB indices https://www.msci.com/eqb/methodology/meth_docs/MSCI_SRI_Filtered_ex_Fossil_Fuels_PAB_Indexes_Methodology.pdf
6.Amundi ETF estimates, February 2022
FOR PROFESSIONAL CLIENTS ONLY
Knowing your risk
It is important for potential investors to evaluate the risks described below and in the fund’s Key Investor Information Document (“KIID”) and prospectus available on our websites www.amundietf.com or www.lyxoretf.com (as the case may be).
CAPITAL AT RISK - ETFs are tracking instruments. Their risk profile is similar to a direct investment in the underlying index. Investors’ capital is fully at risk and investors may not get back the amount originally invested.
UNDERLYING RISK - The underlying index of an ETF may be complex and volatile. For example, ETFs exposed to Emerging Markets carry a greater risk of potential loss than investment in Developed Markets as they are exposed to a wide range of unpredictable Emerging Market risks.
REPLICATION RISK - The fund’s objectives might not be reached due to unexpected events on the underlying markets which will impact the index calculation and the efficient fund replication.
COUNTERPARTY RISK - Investors are exposed to risks resulting from the use of an OTC swap (over-the-counter) or securities lending with the respective counterparty(-ies). Counterparty(-ies) are credit institution(s) whose name(s) can be found on the fund’s website amundietf.com or lyxoretf.com. In line with the UCITS guidelines, the exposure to the counterparty cannot exceed 10% of the total assets of the fund.]
CURRENCY RISK – An ETF may be exposed to currency risk if the ETF is denominated in a currency different to that of the underlying index securities it is tracking. This means that exchange rate fluctuations could have a negative or positive effect on returns.
LIQUIDITY RISK – There is a risk associated with the markets to which the ETF is exposed. The price and the value of investments are linked to the liquidity risk of the underlying index components. Investments can go up or down. In addition, on the secondary market liquidity is provided by registered market makers on the respective stock exchange where the ETF is listed. On exchange, liquidity may be limited as a result of a suspension in the underlying market represented by the underlying index tracked by the ETF; a failure in the systems of one of the relevant stock exchanges, or other market-maker systems; or an abnormal trading situation or event.
VOLATILITY RISK – The ETF is exposed to changes in the volatility patterns of the underlying index relevant markets. The ETF value can change rapidly and unpredictably, and potentially move in a large magnitude, up or down.
CONCENTRATION RISK – Thematic ETFs select stocks or bonds for their portfolio from the original benchmark index. Where selection rules are extensive, it can lead to a more concentrated portfolio where risk is spread over fewer stocks than the original benchmark.
Important information
This material is solely for the attention of professional and eligible counterparties, as defined in Directive MIF 2014/65/UE of the European Parliament acting solely and exclusively on their own account. It is not directed at retail clients. In Switzerland, it is solely for the attention of qualified investors within the meaning of Article 10 paragraph 3 a), b), c) and d) of the Federal Act on Collective Investment Scheme of June 23, 2006.
This information is not for distribution and does not constitute an offer to sell or the solicitation of any offer to buy any securities or services in the United States or in any of its territories or possessions subject to its jurisdiction to or for the benefit of any U.S. Person (as defined in the prospectus of the Funds or in the legal mentions section on www.amundi.com , www.amundietf.com and www.lyxoretf.com ). The Funds have not been registered in the United States under the Investment Company Act of 1940 and units/shares of the Funds are not registered in the United States under the Securities Act of 1933.
This document is of a commercial nature. The Funds described in this document may not be available to all investors and may not be registered for public distribution with the relevant authorities in all countries. It is each investor’s responsibility to ascertain that they are authorised to subscribe, or invest into this product. Prior to investing in the product, investors should seek independent financial, tax, accounting and legal advice.
This is a promotional and non-contractual information which should not be regarded as an investment advice or an investment recommendation, a solicitation of an investment, an offer or a purchase, from Amundi Asset Management (“Amundi”) nor any of her subsidiaries, nor Lyxor International Asset Management (“Lyxor”) and Lyxor Asset Management UK LLP (“Lyxor UK”).
The Funds are respectively Amundi UCITS ETFs (“Amundi ETF”) and Lyxor UCITS ETFs (“Lyxor ETF”). Amundi ETF designates the ETF business of Amundi and includes the funds under both Amundi ETF and Lyxor ETF denomination.
The Funds are French or Luxembourg open ended mutual investment funds respectively approved by the French Autorité des Marchés Financiers or by the Luxembourg Commission de Surveillance du Secteur Financier, and authorized for marketing of their units or shares in various European countries (the Marketing Countries) pursuant to the article 93 of the 2009/65/EC Directive. The Funds can be sub-funds of the following umbrella structures:
For Amundi ETF: Amundi Index Solutions, Luxembourg SICAV, RCS B206810, located 5, allée Scheffer, L-2520, managed by Amundi Luxembourg S.A.
For Lyxor ETF:
- Multi Units France, French SICAV, RCS 441 298 163, located 91-93, boulevard Pasteur, 75015 Paris, France, managed by Lyxor International Asset Management
- Multi Units Luxembourg, RCS B115129 and Lyxor Index Fund, RCS B117500, both Luxembourg SICAV located 28-32, place de la Gare, L-1616 Luxembourg, and managed by Lyxor International Asset Management
- Lyxor SICAV, Luxembourg SICAV, RCS B140772, located 5, Allée Scheffer, L-2520 Luxembourg, managed by Lyxor Funds Solutions
Before any subscriptions, the potential investor must read the offering documents (KIID and prospectus) of the Funds. The prospectus in French for French UCITS ETFs and in English for Luxembourg UCITS ETFs, and the KIID in the local languages of the Marketing Countries are available free of charge on www.amundi.com, www.amundietf.com and www.lyxoretf.com or upon request to client-services-etf@lyxor.com. They are also available from the headquarters of the Amundi Index Solutions SICAV, or the headquarters of Lyxor International Asset Management (as the management company of Multi Units Luxembourg, Multi Units France and Lyxor Index Fund) or of Lyxor Funds Solutions (as the management company of Lyxor SICAV).
Investment in a fund carries a substantial degree of risk (i.e. risks are detailed in the KIID and prospectus). Past Performance does not predict future returns. Investment return and the principal value of an investment in funds or other investment product may go up or down and may result in the loss of the amount originally invested. All investors should seek professional advice prior to any investment decision, in order to determine the risks associated with the investment and its suitability.
It is the investor’s responsibility to make sure his/her investment is in compliance with the applicable laws she/he depends on, and to check if this investment is matching his/her investment objective with his/her patrimonial situation (including tax aspects).
Please note that the management company may de-notify arrangements made for marketing as regards units/shares of the Fund in a Member State of the EU in respect of which it has made a notification.
A summary of information about investors’ rights and collective redress mechanisms can be found in English on the regulatory page at https://about.amundi.com/Metanav-Footer/Footer/Quick-Links/Legal-documentation with respect to Amundi ETFs, and, at https://www.lyxor.com/en/investors-rights-2021-en with respect to Lyxor ETFs.
This document was not reviewed, stamped or approved by any financial authority.
This document is not intended for and no reliance can be placed on this document by persons falling outside of these categories in the below mentioned jurisdictions. In jurisdictions other than those specified below, this document is for the sole use of the professional clients and intermediaries to whom it is addressed. It is not to be distributed to the public or to other third parties and the use of the information provided by anyone other than the addressee is not authorised.
This material is based on sources that Amundi for Amundi ETF, and Lyxor and Lyxor UK for Lyxor ETF consider to be reliable at the time of publication. Data, opinions and analysis may be changed without notice. Amundi, Lyxor and Lyxor UK accept no liability whatsoever, whether direct or indirect, that may arise from the use of information contained in this material. Amundi or Lyxor can in no way be held responsible for any decision or investment made on the basis of information contained in this material.
Updated composition of the product’s investment portfolio is available on www.amundietf.com or www.lyxoretf.com. Units of a specific UCITS ETF managed by an asset manager and purchased on the secondary market cannot usually be sold directly back to the asset manager itself. Investors must buy and sell units on a secondary market with the assistance of an intermediary (e.g. a stockbroker) and may incur fees for doing so. In addition, investors may pay more than the current net asset value when buying units and may receive less than the current net asset value when selling them.
Indices and the related trademarks used in this document are the intellectual property of index sponsors and/or its licensors. The indices are used under license from index sponsors. The Funds based on the indices are in no way sponsored, endorsed, sold or promoted by index sponsors and/or its licensors and neither index sponsors nor its licensors shall have any liability with respect thereto. The indices referred to herein (the “Index”) are neither sponsored, approved or sold by Amundi nor Lyxor nor Lyxor Funds Solutions. Neither Amundi nor Lyxor nor Lyxor Funds Solutions shall assume any responsibility in this respect.
In EEA Member States, the content of this document is approved by Amundi and Lyxor for use with Professional Clients (as defined in EU Directive 2004/39/EC) only and shall not be distributed to the public.
Information reputed exact as of the date mentioned above.
Reproduction prohibited without the written consent of Amundi.
United Kingdom
In the UK, this document is issued by Amundi (UK) Limited, 77 Coleman Street, London, EC2R 5BJ, United Kingdom and Lyxor Asset Management UK LLP (“Lyxor UK”), 77 Coleman Street, London, EC2R 5BJ. Amundi (UK) Limited is authorised and regulated by the Financial Conduct Authority (“FCA”) and entered on the FCA’s Financial Services Register under number 114503. Lyxor UK is authorized and regulated by the FCA entered on the FCA’s Financial Services Register under number 435658. This may be checked at https://register.fca.org.uk/ and further information of its authorisation is available on request.
Amundi Index Solutions SICAV is recognised schemes for the purposes of Section 264 of the Financial Services and Markets Act 2000 (the “FSMA”) of the UK and can be promoted and sold direct to the public in the United Kingdom subject to compliance with the FSMA and applicable regulations made thereunder. Where a fund is an unregulated collective investment scheme under the FSMA it will not carry the protection provided by the UK regulatory system. This document is addressed only to those persons in the UK falling within one or more of the following exemptions from the restrictions in s 238 FSMA:
- Authorised firms under FSMA and certain other investment professionals falling within article 14 of the FSMA (Promotion of Collective Investment Schemes) (Exemptions) Order 2001, as amended (the “CIS Order”) and their directors, officers and employees acting for such entities in relation to investment
- High value entities falling within article 22 CIS Order and their directors, officers and employees acting for such entities in relation to investment;
- Other persons who are in accordance with the Rules of the FCA prior to 1 November 2007 classified as Intermediate Customers or Market Counterparties or on or thereafter classified as Professional Clients or Eligible Counterparties.
The distribution of this document to any person in the UK not falling within one of the above categories is not permitted by Amundi (UK) Limited and may contravene FSMA. No person in the UK falling outside those categories should rely or act on it for any purposes whatsoever. Where a fund is an unregulated collective investment scheme under the UK Financial Services and Markets Act 2000 (“FSMA”) it will not carry the protection provided by the UK regulatory system.
Potential investors in the UK should be aware that none of the protections afforded by the UK regulatory system will apply to an investment in the Funds and that compensation will not be available under the UK Financial Services Compensation Scheme.
Austria
For Amundi ETF: The regulatory documentation of the Amundi ETFs registered for public marketing in Austria are available free of charge, as printed copies, from Société Générale, Vienna Branch, Prinz Eugen Strasse 8, 10/5/Top 11, A-1040 Vienna, Austria, which acts as a paying agent and tax representative, and at www.amundietf.com.
For Lyxor ETF: The regulatory documentation of the Lyxor ETFs registered for public marketing in Austria are available free of charge, as printed copies, from: Erste Bank der Österreichische Sparkassen AG, Am Belvedere 1, A-1100 Vienna, Austria, which acts as a paying agent and tax representative, and at www.lyxoretf.de.
Sweden
The Funds have been passported into Sweden pursuant to the Swedish Securities Funds Act (as amended) (Sw. lag (2004:46) om värdepappersfonder), implementing the UCITS IV Directive and may accordingly be distributed to Swedish investors. The Key Investor Information Document (“KIID”) (in Swedish) and the prospectuses for the funds, as well as the annual and semi-annual reports are also available from the Swedish paying agent free of charge.
For Amundi ETF and Lyxor ETF: The name and details of the Swedish paying agent are Skandinaviska Enskilda Banken AB (publ) through its entity Transaction Banking, SEB Merchant Banking, with its principal offices at Kungsträdgårdsgatan 8, SE-106 40 Stockholm, Sweden.